Section D DEMOGRAPHIC OVERVIEW
D.1 Data Collection and Accuracy
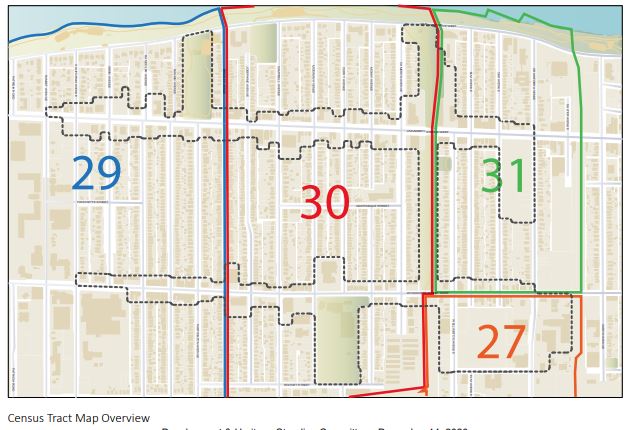
The demographic data used for the purposes of the Phase I Deliverables report are extracted from Statics Canada’s 2016 Canadian Census of Population and the 2011 National Household Survey. The 2016 data and 2011 data had different collection methods, therefore in most cases it is not accurate to compare year to year data. However, the population numbers reported can be compared between the 2011 and 2016 census years as the collection methods for population counts was the same. The most notable adjustment to the 2016 Census was the reinstatement of the mandatory long-form census questionnaire. A sample of 25% of Canadian households received a long-form questionnaire, which also consists of short-form questions. Furthermore, income-related questions were eliminated as Statistics Canada retrieved the relevant information from personal income tax and benefits. Therefore, the data is not comparable to previous years due to discrepancies in questions and collection methods. The Census Tracts that had boundaries that intersect the University Avenue West or Wyandotte Street West corridors that are subject of this study were included in the demographic review. This resulted in four census tracts (0029.00, 0030.00, 0031.00, 0027.00) being reviewed for the purposes of this study, shown below:
D.2.1 Total Population
Census Tract 27 has the smallest population, containing a sum of 1070 residents. Within Census Tract 29, there is a total population of 2345 people. Census Tract 30 has a population of 3360, making it the most populated area out of the four. Lastly, Census Tract 31 is home to 1505 individuals.
D.2.2 Population Growth
The total population of the study area as of 2016 is 8280, which is a 6.8% increase in the number of residents since 2011. The population growth experienced by the study area is more than double that of the City of Windsor, which has an increase of only 3.1%. The rapid population growth within the study area is particularly visible in Census Tract 31 as this CT experienced the most prominent growth, as its population has increased by 11.4%. An increase in senior residents has contributed to the substantial population growth of Census Tract 31.