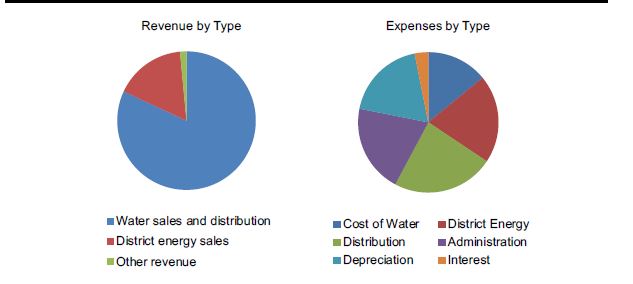
f i n a n c i a l HIGHLIGHTS Fiscal Year ending December 31, 2019
| (in thousands of dollars) | 2019 | 2018 | 2017 | 2016 | 2015 |
|---|---|---|---|---|---|
| Operations Total revenue | 64,833 | 64,146 | 62,237 | 62,126 | 59,362 |
| Water distribution revenue | 53,653 | 52,193 | 50,792 | 50,341 | 47,243 |
| Operating expenses (excluding depreciation) | 36,559 | 37,439 | 37,128 | 36,906 | 37,086 |
| EBITDA | 28,274 | 26,707 | 25,109 | 25,220 | 22,276 |
| Depreciation | 9,639 | 8,556 | 8,715 | 7,180 | 6,589 |
| Net Income | 17,317 | 16,410 | 14,735 | 16,177 | 13,806 |
| Balance Sheet Cash and investments | 24,461 | 25,181 | 28,854 | 33,051 | 31,896 |
| Property, Plant & Equipment | 312,697 | 297,680 | 279,242 | 258,837 | 239,572 |
| Total Assets | 350,074 | 334,326 | 319,511 | 301,792 | 280,700 |
| Long-term borrowings | 51,381 | 51,365 | 51,350 | 51,332 | 51,320 |
| Equity | 272,682 | 254,501 | 237,680 | 223,287 | 207,174 |
| Cash flows | |||||
| Operating | 24,083 | 21,543 | 26,134 | 25,074 | 20,363 |
| Investment in Infrastructure | 23,981 | 25,094 | 29,509 | 23,098 | 17,464 |
