AMERICAN ACADEMY OF DEVELOPMENTAL MEDICINE & DENTISTRY
The Proportion of Children with Disabilities Varies Greatly in US States
BY H. BARRY WALDMAN, DDS, MPH, PHD AND STEVEN P. PERLMAN, DDS, MSCD, DHL (HON)
NUMBERS AND PERCENT
The following findings for 2018-2019 are from the latest National Survey of Children's Health by the Data Resource Center for Child and Adolescent Health. It was estimated that 18.9% of U.S. resident children and adolescents (13,871,360 youngsters: 0 to 17 years of age) had one or more disabilities. The percent of this population with disabilities by state ranged from 13.8% in Hawaii to 24.2% in Louisiana. (see Table 1) 1
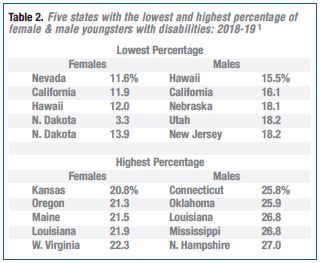
Hawaii to 24.2% in Louisiana. (see Table 1) 1 By gender, the percent of young females with disabilities was less than their male counterparts; ranging among females from 11.6% in Nevada to 22.3% in West Virginia. The percent of young males with disabilities ranged from 15.5% in Hawaii to 27.0% in New Hampshire. (see Table 2) 1
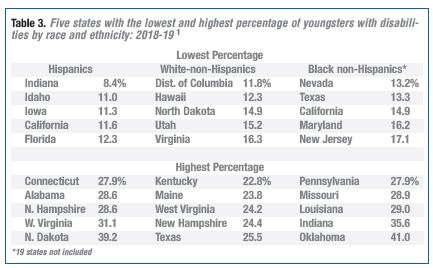
By race and ethnicity, the percent of young Hispanics with disabilities ranged from 8.4% in Indiana to 39.2% in North Dakota. The percent of young White non-Hispanics with disabilities ranged from 11.8% in the District of Columbia to 25.8% in Texas. The percent of young Black non-Hispanics (for 31 states) ranged from 13.2% in Nevada to 41.0% in Oklahoma. (see Table 3) 1 Nationally, among adults in 2020, 61 million (26%) lived with a disability.
• An estimated 12.7% percent of the entire U.S. population had a disability.
• The estimated total state resident population with one or more disabilities ranged from 9.1% in Vermont to 19.8% in West Virginia. (see Table 4) 2,3
Table 1. Five states with the lowest and highest percentage of youngsters with disabilities: 2018-19 1
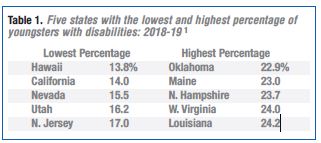
Table 2. Five states with the lowest and highest percentage of female & male youngsters with disabilities: 2018-19
PROVIDING FOR THE YOUNGSTERS AND NOT SO YOUNG WITH DISABILITIES
By economics: Medicaid represents $1 out of every $6 spent on healthcare in the US and is the major source of financing for states to provide coverage to meet the health and long-term care needs of their low-income residents. The federal share of Medicaid is determined by a formula set in statute that is based on each state's per capita income.
The formula is designed so that the federal government pays a larger share of program costs for the poorer states. The federal share varies by state from a low of 50% to a high of 77% in 2020. The poorer states, i.e. those states that contributed a smaller percent of Medicaid costs, their share ranged from 21.1% for New Mexico, to 21.3% for West Virginia, 22.0% for Kentucky, 22.4% for Montana and 23.2% for Arizona. 4,5
The Supplemental Security Income (SSI) program is one of the few federal programs to provide monthly cash assistance to lowincome families of children with intellectual disabilities that result in severe impairment. SSI eligibility often improves access to health services for children with intellectual disabilities as it assures referral to other state programs. There are unexplained and large discrepancies across states (emphasis added) in the review and receipt of SSI benefits for lowincome children with mental disabilities. 6
By educational programs: Inclusion of students with disabilities in the least restrictive educational environment has proven to be valuable in educating students with disabilities. Historically, beginning with the passage of PL 94-142 (1975), the inclusion of students with disabilities in the least restrictive environment has become a focal point for litigation and a rallying issue for advocates. Yet, it is not generally known that levels of inclusion vary wildly across states and school districts. "Recent data show variations by state from 34% to 91% (emphasis added) in the proportion of special education students who are 'fully included' in general education settings." 7
By jobs: In 2020, 17.9% of persons with a disability were employed, (down from 19.3 percent in 2019). For persons without a disability, 61.8% were employed in 2020, (down from 66.3% in the prior year). The unemployment rates for persons with and without a disability both increased from 2019 to 2020, to 12.6% and 7.9%, respectively. Data regarding both groups for 2020 reflect the impact of the coronavirus (COVID-19) pandemic. Nevertheless, a large proportion of persons with a disability (about 8 in 10) were not in the labor force in 2020, compared with about 3 in 10 of those with no disability. In part, this reflects the older age profile of persons with a disability.8
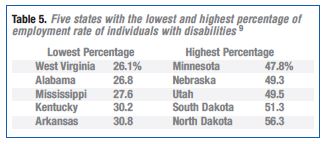
At the state level, the employment rate of individus with disabilities ranged from 26.1% in West Virginia to 56.3% in North Dakota. (see Table 5) 9
Table 3. Five states with the lowest and highest percentage of youngsters with disabilities by race and ethnicity: 2018-19 1
MAPS AND LEGENDS: When seeking to find the best cities to raise a child with special needs, a parent usually considers factors like the availability of housing, affordable family entertainment options, proximity to hospitals and, of course, being within the best school districts in the county.
Table 4. Five states with the lowest and highest percentage of the total population with disabilities, 2019
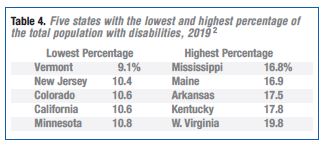
Table 5. Five states with the lowest and highest percentage of employment rate of individuals with disabilities 9
BEST PLACES TO LIVE IN THE US WITH CHILDREN WITH SPECIAL NEEDS
A study of the nation's 150 most populated cities across three primary dimensions that impact on the disability community (economic environment, quality of life and health care report) ranked them:
1. Overland Park, KS
2. Scottsdale, AZ
3. Peoria, AZ
4. Tampa, FL
5. St. Petersburg, FL
146. Worcester, MA
147. Moreno Valley CA
148. San Bernardino, CA
149. Jersey City, NJ
150. Providence, RI 10,11
When seeking to find the best cities to raise a child with special needs, a parent usually considers factors like the availability of housing, affordable family entertainment options, proximity to hospitals and, of course, being within the best school districts in the county. However, for parents of children with special needs, there are often more important factors involved. Your child with special needs is unique and has extraordinary requirements. Only you and your support team can make these essential decisions.
ABOUT THE AUTHORS:
H. Barry Waldman, DDS, MPH, PhD is a SUNY Distinguished Teaching Professor, Department of General Dentistry, Stony Brook University, NY. E-mail: h.waldman@stonybrook.edu. Steven P. Perlman, DDS, MScD, DHL (Hon) is the Global Clinical Director and founder, Special Olympics, Special Smiles; and Clinical Professor of Pediatric Dentistry, The Boston University Goldman School of Dental Medicine.
References
1. Data Resource Center for Child and Adolescent Health. 2018-19 National Survey of Children's Health. Available from: childhealthdata.org/browse/survey Accessed April 14, 2021. childhealthdata.org/browse/survey/allstates?q=7687&g=793 Accessed April 14, 2021.
2. Statista.com Percent of people in the U.S. with a disability as of 2019 by state. Available from: statista.com/statistics/794278/disabled-population-us-by-state Accessed April 16, 2021.
3. Total US population with a disability. Available from: google search.com Accessed April 16, 2021.
4. Rudowitz R et al. Kaiser Family Foundation. Medicaid financing: the basics. Available from: kff.org/medicaid/state-indicator/federalstate-share-of-spending/?currentTimeframe=0&sortModel=%7B%22colId%22:%22Federal%22,%22sort%22:%22des c%22%7D Accessed April 16, 2021.
5. Kaiser Family Foundation. Federal and state share of Medicaid spending. Available from: kff.org/medicaid/state-indicator/federalstate-share-of-spending/?currentTimeframe=0&sortModel= %7B"colId":"Federal","sort":"desc"%7D Accessed April 16, 2021.
6. Hoaqwood K, et al. State-to-state variation in SSI enrollment for children with mental disabilities: an administrative and ethical challenge. Available from: Psychiatric Services 68(2): 195-98, 2017.
7. Christiana KL, Conroy J. The mystery of wide variation in rates of inclusion: does money make a difference. Available from: socialinnovationsjournal.org/editions/issue-60/75-disruptive-innova- tions/3073-the-mystery-of-wide-variation-in-rates-of-inclusion-does-money-make-a-difference Accessed April 16, 2021.
8. Bureau of Labor Statistics. Persons with a disability: Labor force characteristics – 2020. Available from: bls.gov/news.release/pdf/disabl.pdf Accessed April 17, 2021.
9. Disabled World. 2019 report on U.S. disability employment rate by state. Available from: disabled-world.com/disability/statistics/2019-chart.php Accessed April 17, 2021.
10. Abilities.com. Best and worst places to live for people with disabilities. Available from: abilities.com/community/best-worst-cities.html Accessed April 17, 2021.
11. Real Estate Agent.com Best places to live in the US with special needs children. Available from: realestateagent.com/blog/best-places-to-live-in-the-us-with-special-needs-children Accessed April 17, 2021.
AMERICAN ACADEMY OF DEVELOPMENTAL MEDICINE AND DENTISTRY
The American Academy of Developmental Medicine and Dentistry (AADMD) was organized in 2002 to provide a forum for healthcare professionals who provide clinical care to people with neurodevelopmental disorders and intellectual disabilities (ND/ID). The mission of the organization is to improve the quality and assure the parity of healthcare for individuals with neurodevelopmental disorders and intellectual disabilities throughout the lifespan.