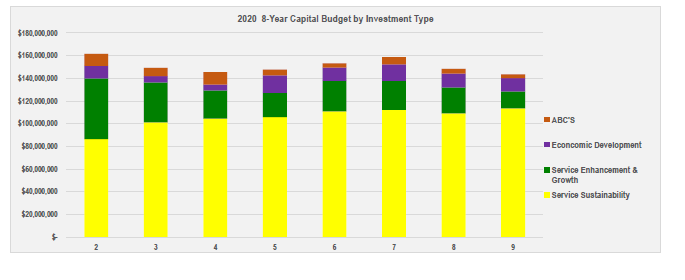
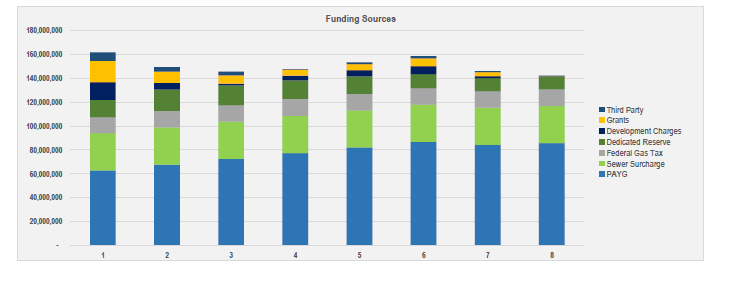
| Allocation of Available Funding - by Major Category: | 2020 | % of Budget | 2021 | % of Budget | 2022 | % of Budget | 2023 | % of Budget | 2024 | % of Budget | 2025 | % of Budget |
| Roads Infrastructure | 43,761,445 | 27% | 44,166,235 | 30% | 44,760,298 | 31% | 42,897,828 | 29% | 48,158,357 | 31% | 52,575,310 | 33% |
| Sewers Infrastructure | 39,762,682 | 25% | 41,890,102 | 28% | 39,188,191 | 27% | 47,873,122 | 32% | 47,840,595 | 31% | 44,230,709 | 28% |
| Transportation | 27,175,847 | 17% | 14,649,032 | 10% | 15,697,080 | 11% | 12,085,355 | 8% | 15,695,556 | 10% | 10,306,572 | 6% |
| Parks & Recreation | 17,239,598 | 11% | 17,367,966 | 12% | 15,239,109 | 10% | 15,243,244 | 10% | 15,671,211 | 10% | 15,106,017 | 10% |
| Corporate Property Infrastructure | 6,694,000 | 4% | 10,915,601 | 7% | 8,114,500 | 6% | 5,449,099 | 4% | 8,616,800 | 6% | 9,750,500 | 6% |
| Corporate Technology | 5,251,500 | 3% | 7,461,500 | 5% | 6,410,000 | 4% | 3,596,000 | 2% | 1,778,140 | 1% | 5,776,696 | 4% |
| Community & Economic Development | 7,819,970 | 5% | 2,243,330 | 2% | 1,820,000 | 1% | 12,170,000 | 8% | 8,450,000 | 6% | 11,418,359 | 7% |
| Capital Reserve Replenishment | 3,210,000 | 2% | 3,210,000 | 2% | 3,210,000 | 2% | 3,210,000 | 2% | 3,210,000 | 2% | 3,210,000 | 2% |
| Agencies, Boards & Committees (ABC's) | 10,633,104 | 7% | 7,284,037 | 5% | 11,074,703 | 8% | 5,056,752 | 3% | 3,734,000 | 2% | 6,219,303 | 4% |
| Total Allocation of Available Funding | 61,548,146 | 100% | 149,187,803 | 100% | 145,513,881 | 100% | 147,581,400 | 100% | 153,154,659 | 100% | 158,593,466 | 100% |


